A collection of electoral data for the Maltese Islands

District Results, Count by Count
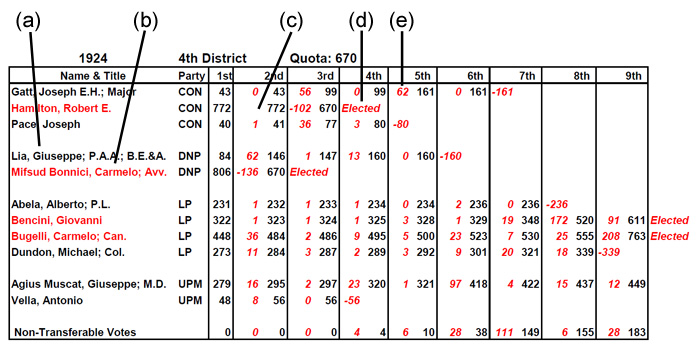
As indicated by the sample below, these files show the votes received and transferred by various candidates, separately for each district. There have been 221 district contests thus far.
| 1921 | 1924 | 1927 | 1932 | 1939 |
| 1945 | 1947 | 1950 | 1951 | 1953 |
| 1955 | 1962 | 1966 | 1971 | 1976 |
| 1981 | 1987 | 1992 | 1996 | 1998 |
| 2003 | 2008 | 2013 |
(a) Candidate names are grouped by party. In earlier elections, all candidates were listed in simple alphabetical order.
(b) Names of candidates winning a seat are printed in red.
(c) When a candidate has votes in excess of the quota, or has been eliminated, no further vote transfers can involve such a candidate and the applicable cells are left blank (rather than contain a zero). This should make it visually easier to view the patterns in the distribution and destination of transfer votes, to those candidates who remain eligible to receive transfer votes.
(d) The indication that a candidate has been elected is placed in the column immediately following the count where election was effected.
(e) The transferred votes are presented in red and italic letters to make them more easily distinguishable from the vote totals.